Happenstand Stats: Days of the Week (or Scheduling Your Next Event)
For the past year and a half I’ve been batch contributing listings for one-time events such as lectures, screenings, and workshops to Happenstand.com. These events are compiled at the outset of each season for the Pickpocket Almanack’s master calendar, the jumping off point for the 5 faculty who select events from across the Bay Area to construct courses. In the process I became curious about some of the statistics that might be available through mining the Happenstand database, the best visual arts calendar in the Bay Area.
In conversation with Lucas Shuman, who built and maintains Happenstand, we produced the following data visualizations to consider what days of the week are the most populated by art events. We thought this information might be useful, even valuable, to those individuals at institutions programming and scheduling upcoming events.
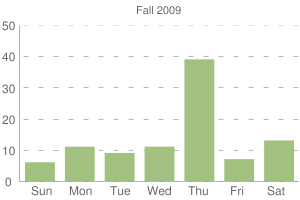
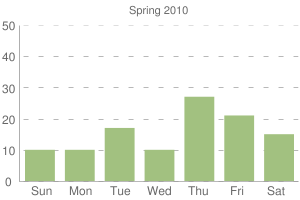
Because the Pickpocket Almanack events are flagged in the database, we can separate out one-time events from other events which mark a beginning, the opening night of an exhibition for example. It’s not a perfect separation between the two pools of data, however, because some one-time events appear in rest of the Happenstand database (we don’t know how many) and are never flagged for Pickpocket Almanack. This first set of graphs are just the Pickpocket Almanack one-time events.
Reading these graphs it’s clear that Thursday is the most popular evening for one-time-only events. The sample size, for roughly a year and a half of activity, is about 300 events. These are primarily only the events that are scheduled well in advance of their happening, through websites and institutional calendars etc. This information doesn’t necessarily help one decide to program on Thursday night or not, but it does let one know that there will be some competition on Thursdays. One might also read these graphs as evidence that there’s a larger available audience for these kinds of events on Thursdays, when compared to the already over-programmed Fridays or Saturdays (see below), which are typical “nights-out” for 5-day-work-week Americans.
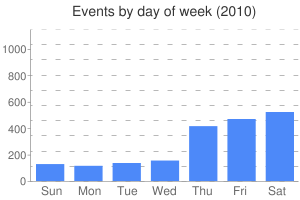
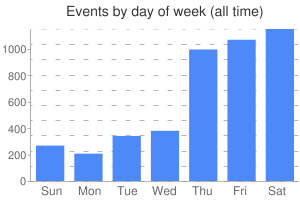
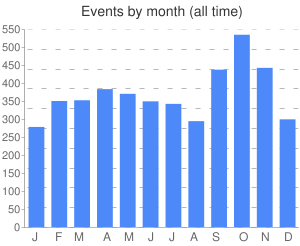
Because Happenstand has steadily gained popularity over time, comparing the overall database between years is tricky. For example, looking at all the entries for each year shows a steady increase from 2008 (990 events) to 2009 (1461 events) to 2010 (1940 events). One might read this increase as a growth of arts activity in the Bay Area, but it’s more likely the increased use and visibility of Happenstand itself (which appeared on the web in January 2008). It’s startling to acknowledge that Happenstand has just a percentage, however large, of the overall events in the Bay Area. If we assume that the most recent number is the most accurate, we might say there are approximately 2,000 events a year, which means there are approximately 5.5 events every day of the year, or about 38 a week. Realizing that this activity isn’t evenly distributed throughout the year, we were also curious about the most active months, shown in the last graph below.
For exhibition openings, the weekly layout is much as we had expected: most of the activity falls on Fridays and Saturdays, with Thursdays a close third. Looking to the monthly chart, It seems the primary seasons for visual culture in the Bay Area are spring — February, March, April, May — and fall — September, October, November. January, August, and December are the least programmed months (in almost equal measure), and we might therefore suppose that it’s a result of, or in response to, a smaller audience. The summer months of June and July, which are considered dead-time in much of the art world, are quite active in the Bay Area. Looking from year to year, it appears these trends are quite consistent, almost stable. I was curious about the busiest day of the year, and it turns out that November 5th was the busiest day in 2010 and 2009, with 23 and 20 events respectively. This date falls right at the end of the October, the most programmed month by far in the Bay Area.


Comments (1)
Thanks Joseph. I’m going to start an August Monday movement…